CarbonNeutral® certification is an action that represents immediate positive impact on GHG emissions. Clearly over time the goal of each organization should be to reduce GHG emissions to zero in accordance with its reduction targets, through the reduction in the use of non-renewable supply, increase in energy efficiency, switching to renewable energy, and through technological innovation.
The organization should develop a GHG reduction plan to deliver internal emissions reductions, taking into consideration the main sources of GHGs from the subject and the likely cost effectiveness of alternative emission reduction projects. With time, technological innovation has the ability to make low carbon projects viable. Understanding this project landscape and how much an organization can invest in low carbon transformation without impacting competitive performance are important inputs to an effective carbon reduction plan.
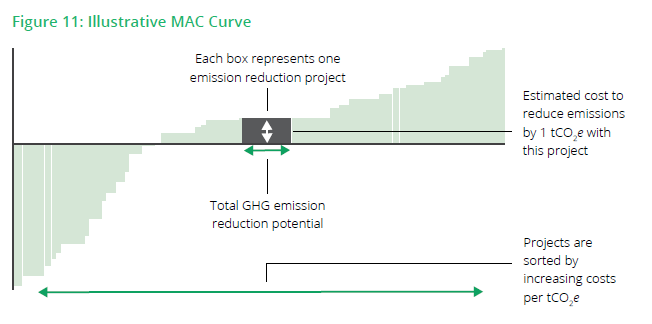
An excellent framework to assist organizations in evaluating a range of internal GHG reduction projects is marginal abatement cost analysis, an economic concept that measures the cost of reducing one more unit of GHG emissions. Marginal abatement costs are presented on a marginal abatement cost curve or MAC curve, a graphical representation of the cost and scale of GHG reduction projects. While there are many more aspects to consider beyond scale and cost, they are useful tools to guide corporate decision making among a variety of GHG reduction projects.
Figure 11 illustrates a MAC curve. Each rectangle on the MAC curve represents a different project to reduce GHG emissions. The width of each box represents the emission reduction potential a project can deliver compared to business-as-usual, and the height of each box represents the average cost of reducing one tonne of GHGs through that project.